
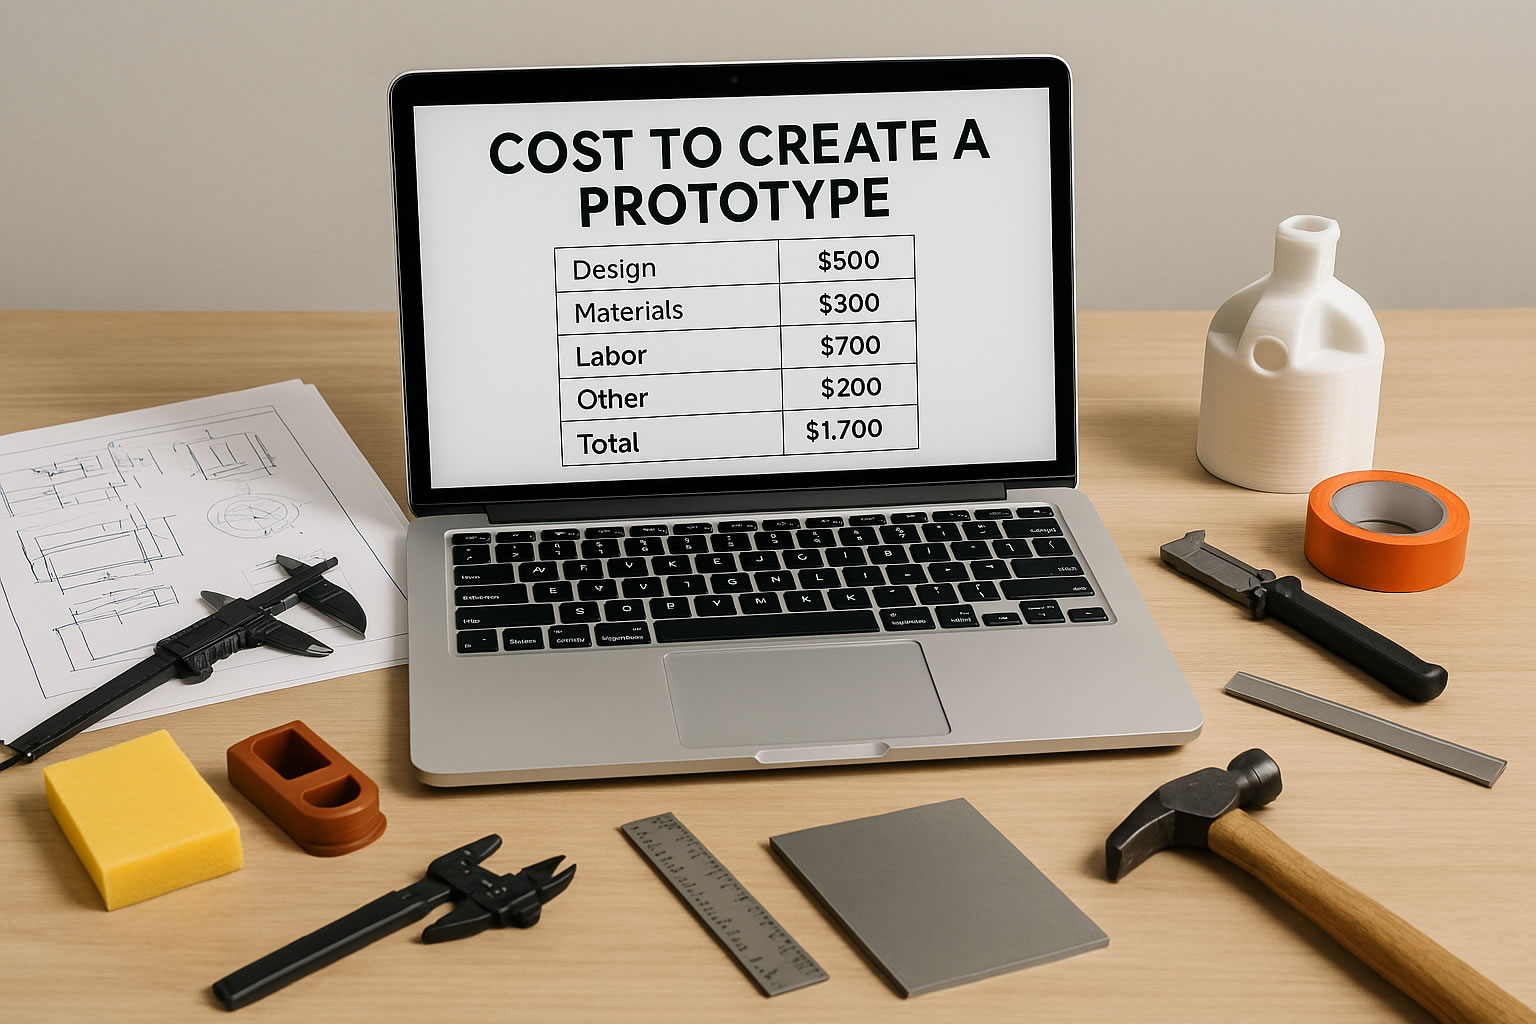
Inventors getting prototype quotes often experience the same surprise: the same prototype, requested from three different vendors, comes back with quotes spanning an order of magnitude. The variation isn’t random. It reflects real decisions — some made by the inventor, some made by the vendor — about complexity, tolerances, materials, process selection, iteration count, and documentation quality. Each of these is a cost driver that inventors can either control deliberately or have controlled for them by default. For inventors, entrepreneurs, and small business owners with limited budgets, understanding the cost drivers is the difference between prototyping that protects the launch and prototyping that burns budget without delivering proportional value. This guide covers the seven categories of cost drivers in prototype manufacturing and what an inventor can do about each one across Rabbit’s four-phase development model.
Quick Answer
Prototype manufacturing costs are driven by seven main factors: design complexity (part count, geometric features, undercuts), tolerances and surface finish requirements (tighter and finer multiplies cost), material selection (commodity vs engineering vs exotic), process-to-volume matching (wrong process for volume can multiply cost), iteration count (poorly planned iterations multiply), documentation and coordination quality (incomplete documentation creates hidden cost), and vendor selection. Most cost drivers are within the inventor’s control through deliberate design decisions during Phase 2. The cheapest prototyping decisions are made early, by experienced engineers, with the production economics in view from the start.
Key Facts
Prototype quotes can vary by an order of magnitude for the same prototype — the variation reflects real decisions about complexity, tolerances, materials, process, and iteration that can be examined and controlled
Tolerances are among the most underappreciated cost drivers — the difference between standard machining tolerances and precision tolerances can be a 5–10x per-feature cost multiplier
Process-to-volume mismatch is one of the most expensive single mistakes — 3D printing 500 units, CNC machining 5,000 units, or hard tooling for 1,000 units each multiply cost compared to the right process for the volume
Each prototype iteration has a cost; poorly-planned iterations multiply that cost across cycles that surface the same lesson at progressively higher fidelity
Documentation gaps create hidden costs that don’t appear on quotes — vendor questions, wrong assumptions, version control failures, and re-iteration time all add up to significant overhead in unmanaged prototype work
For first-time inventors, the practical implication is that prototyping cost isn’t a fixed number for a given product — it’s a range whose specific value depends on dozens of decisions made across the development process. Most of those decisions can be influenced. The discipline of making them deliberately is what keeps prototyping productive at a budget the project can actually support.
Key Takeaways
Prototype cost is driven by design decisions, process selection, material choices, and iteration discipline — most of which are controllable
Design complexity (part count, geometric features, undercuts) is one of the largest single cost drivers and the one most directly controlled by design decisions
Tolerances and surface finish should be specified at the loosest acceptable level — every step tighter or finer is a cost multiplier
Material selection costs vary across orders of magnitude; commodity materials are usually the right starting point unless the application requires otherwise
Process selection should match the volume and the question being asked — 3D printing, CNC, soft tooling, and hard tooling each have economic ranges
Iteration count is shaped by upfront DFM and fidelity discipline — not by the per-iteration cost of the prototype method
Integrated documentation, single-team coordination, and complete tech packages reduce the hidden costs that fragmented vendor relationships generate
Table of Contents
Why Prototype Manufacturing Costs Vary So Widely
Design Complexity: How Features, Parts, and Geometry Drive Cost
Tolerances and Surface Finish: What "Tight" Actually Costs
Material Selection: When Premium Materials Are Worth It
Process Selection: Matching Method to Volume and Question
Iteration Count: How Multiple Cycles Multiply Cost
Documentation, Coordination, and Hidden Vendor Costs
How Rabbit Product Design Manages Prototype Cost Across the Four Phases
Why Prototype Manufacturing Costs Vary So Widely
A consumer product inventor asks three prototype vendors to quote a single part. The quotes come back: $400, $2,200, and $7,500. None of the vendors is dishonest. Each is quoting against a different interpretation of what the prototype actually requires. The cheap quote assumes commodity material, standard tolerances, a single-method build, and limited inspection. The expensive quote assumes premium material, tight tolerances, multi-process construction, full inspection, and certification-quality documentation. The middle quote assumes something between. Until the inventor knows what they actually need, every quote is comparing apples to oranges — and the cheapest quote often delivers a prototype that doesn’t answer the question the inventor was trying to ask.
The variation in prototype quotes reflects real cost drivers that can be examined and understood. Some are within the inventor’s control. Design complexity, tolerance specifications, material selection, surface finish requirements, and fidelity choices are all design-side decisions. Process selection (which manufacturing method to use), iteration discipline (how many cycles, what each tests), and documentation quality (how complete is the tech package) are all process-side decisions. Other drivers — vendor capacity, material market prices, regional labor cost — are external. The inventor’s job is to make the design-side and process-side decisions deliberately rather than by default, so the cost driven by those decisions reflects what the project actually needs.
Different Rabbit verticals have different cost-driver profiles. Consumer products (typically destined for injection molding) accumulate cost from tolerance specifications, surface finish, and tooling complexity. Soft goods (bags, cases, wearables, sports gear, pet products) accumulate cost from material MOQs, sample iterations, and lab dip cycles. Hardwood products (furniture, fixtures, displays, storage) accumulate cost from material grade, joinery complexity, and finishing labor. Electronic products and IoT devices accumulate cost from PCB complexity, antenna integration, certification testing, and firmware-hardware coordination. Understanding the cost profile of the specific vertical is the first step in managing prototype cost intelligently.
For first-time inventors, the most common pattern is to focus on the per-prototype unit cost — the quoted number on the invoice — while missing the total prototype cost across iterations, vendors, and integration time. A vendor whose per-part quote is the lowest may produce parts that require additional iterations because the documentation, materials, or process was wrong for what the project needed. A vendor whose per-part quote is higher may produce parts that don’t require iteration because the senior engineering judgment built into the quote prevented the rework that the cheaper quote would have generated. Total cost of prototyping is usually a different number than the lowest per-unit quote suggests.
This guide walks through the seven major cost-driver categories: design complexity, tolerances and surface finish, material selection, process selection, iteration count, documentation and coordination, and where each lives in Rabbit’s four-phase development model. Each driver can be understood, examined, and influenced — turning prototype cost from a black box into a set of deliberate decisions.
Prototype quotes can vary by an order of magnitude for the same prototype — the variation reflects real decisions, not vendor pricing games.
Some cost drivers are within the inventor’s control (design decisions, process selection, documentation); others are external (material prices, vendor capacity).
Different verticals have different cost-driver profiles — consumer products vs soft goods vs hardwood vs electronics each accumulate cost differently.
Total cost of prototyping is usually different from the lowest per-unit quote.
The seven major cost-driver categories are design complexity, tolerances, materials, process, iteration, documentation, and coordination.
Prototype cost is not a black box. It’s the cumulative result of decisions an inventor can examine and influence. The discipline of understanding the drivers is what makes the cost manageable rather than mysterious.
Design Complexity: How Features, Parts, and Geometry Drive Cost
Design complexity is one of the largest single cost drivers in prototype manufacturing — and one of the most directly within the inventor’s control. Every additional part, every additional feature, every additional geometric constraint either costs hours of machining or labor, complicates inspection, or both. Reducing unnecessary complexity is among the highest-leverage cost-management decisions an inventor can make at the design stage.
Part count is the most direct complexity driver. A product made of three injection-molded parts costs less to prototype than the same product made of fifteen parts, even when the total volume of material is similar. Each part requires its own tooling, its own setup, its own inspection, and its own assembly relationship with neighboring parts. Design-for-assembly thinking — reducing part count by combining functions, eliminating fasteners through snap-fits, integrating features that would otherwise require separate components — directly reduces prototype cost while also reducing production cost at scale.
Geometric features each carry their own cost. Undercuts — features that would prevent a part from demolding cleanly — either require side actions in tooling (which add cost and complexity) or require the design to be modified to eliminate them. Thin walls require careful material selection and may not flow correctly in injection molding. Deep pockets in machined parts require longer tools, slower feeds, and sometimes multiple setups. Internal features that aren’t accessible from outside the part may require multi-piece construction or specialized machining. Each of these features may be necessary for the design intent — but each one should be deliberate, not default.
Asymmetric features that prevent simple manufacturing processes are a particularly underappreciated cost driver. A feature that seems minor in CAD — a small protrusion on one side, a non-uniform wall thickness, an off-center boss — may force the entire part into a more expensive manufacturing process. A design that could have been molded simply if symmetric may require a more complex tool, more expensive material handling, or even an entirely different process if asymmetric.
For soft goods specifically, design complexity drivers include the number of pattern pieces, the number of construction operations, the number of hardware integration points, the number of fabric types used in a single product, and the number of seams that require specific specifications (stitch density, seam type, reinforcement). A bag with twenty pattern pieces, six fabrics, three closure mechanisms, and complex internal organization will cost dramatically more to prototype than a bag with eight pattern pieces, two fabrics, one closure, and simple construction — even when the finished products look similar from outside.
For hardwood products, complexity drivers include the number of joinery types (mortise-and-tenon, dovetail, dowel, and floating tenon each require different setup and skill), the number of distinct wood species used in a single piece, the complexity of finishing (number of stain layers, topcoat applications, sanding stages), and the number of hardware integration points. A simple casegood with consistent joinery and finishing throughout costs less to prototype than a complex piece with multiple joinery types and elaborate finishing.
For electronics, complexity drivers include the number of PCBs in the product, the layer count of each PCB (4-layer vs 6-layer vs 10-layer), the number of unique components (and their sourcing complexity), the firmware complexity, and the integration depth with mobile apps and cloud infrastructure. A simple sensor with single PCB and basic firmware costs dramatically less to prototype than a connected product with multiple PCBs, RF subsystems, complex firmware, and full app integration.
Part count: more parts = more cost; design-for-assembly thinking reduces both prototype and production cost.
Geometric features: undercuts, thin walls, deep pockets, internal features each add cost.
Asymmetric features may force a more expensive manufacturing process than necessary.
Soft goods complexity: pattern pieces, fabric types, hardware integration, construction operations.
Hardwood complexity: joinery types, wood species, finishing stages, hardware integration.
Electronics complexity: PCB count and layers, unique components, firmware, app and cloud integration.
Every complexity decision is a cost decision. Inventors who understand which features are essential to the product’s value and which are aesthetic additions can make complexity decisions that protect both the design and the budget.
Tolerances and Surface Finish: What "Tight" Actually Costs
Tolerances and surface finish are among the most underappreciated cost drivers in prototype manufacturing. The "tighter is better" misconception leads inventors to specify precision that costs significantly more without delivering proportionally more value — because the design doesn’t actually depend on the tight tolerance, and the additional cost is paid on every unit produced, forever.
Standard machining tolerances are typically in the range of plus-or-minus a few thousandths of an inch (for metric users, plus-or-minus tens of microns). These tolerances are achievable on standard equipment with standard inspection, at standard cost. Tight tolerances — plus-or-minus tenths of a thousandth, or plus-or-minus a few microns — require precision equipment, longer cycle times, more careful setup, more rigorous inspection, and often more expensive material. The cost difference between standard and tight tolerances can be five to ten times per feature, or more for the tightest precision work.
The discipline is to specify the loosest tolerance that still works for each feature. A tolerance should be tight only because the design genuinely depends on that precision — because a mating part needs to fit, a seal needs to maintain pressure, an optical element needs to align, a moving part needs to clear an obstacle. Tolerances that are tight because the CAD package suggested a default precision, or because the inventor associated tight tolerance with quality, are tolerances that cost more without delivering value. Every over-specified tolerance is paid for in every unit produced, not just in the prototype.
Surface finish follows similar economics. Surface finish specifications use Ra (arithmetic average roughness) values that describe how smooth a surface is. Machined surfaces straight off a tool have a finish in one range; polished surfaces have a finish in a much finer range; mirror-finish polishing is finer still. Each step from rougher to finer typically doubles cost — not linearly increases, doubles. A surface specified at mirror finish when functional finish would have worked costs many times more without delivering proportional value.
Cosmetic surfaces (the surfaces a customer sees and touches at retail) genuinely benefit from finer finish — they’re part of the product’s perceived quality and the brand’s positioning. Functional surfaces (internal features, mating surfaces, structural surfaces) typically don’t. The discipline is to specify cosmetic-grade finish where the customer interacts with the surface and functional-grade finish everywhere else. Designs that specify cosmetic finish uniformly across all surfaces pay for visual quality the customer never sees.
For soft goods, the equivalent concept is stitch density (stitches per inch, SPI) and seam construction quality. Stitches per inch specifications should match what the seam needs to do structurally and visually — over-specifying SPI on a non-structural seam adds cost across every unit produced. Premium seam constructions (French seams, bound seams, taped seams) cost more than standard seams and should be specified only where they add real value.
For hardwood products, equivalents include the sanding grit progression (each additional sanding step adds labor) and the finish layers (each additional topcoat application costs material and drying time). Specifying a 220-grit final sanding when 180-grit would have been adequate for the visible finish layers costs labor that doesn’t change the customer experience. Specifying three topcoats when two would have delivered the same durability and feel doubles the application cost.
Standard machining tolerances cost dramatically less than tight tolerances — 5–10x per feature is typical.
Specify the loosest tolerance that still works — over-specification is paid for in every unit.
Each step finer in surface finish typically doubles cost — not linearly increases.
Cosmetic surfaces benefit from finer finish; functional surfaces typically don’t.
Soft goods: stitch density and seam construction follow the same logic.
Hardwood: sanding grit progression and topcoat layer count are equivalent decisions.
Tolerances and surface finish are the cost drivers most directly influenced by deliberate specification. Inventors who set tolerances at the right level for each feature, and finish at the right level for each surface, pay only for the precision and quality the design actually needs.
Material Selection: When Premium Materials Are Worth It
Material costs vary across orders of magnitude. Commodity materials (basic ABS plastic, hot-rolled steel, plywood, standard polyester fabric) are inexpensive and widely available with short lead times and low minimum orders. Engineering materials (food-safe silicone, medical-grade plastic, FSC-certified hardwood, technical performance fabrics) cost meaningfully more. Exotic materials (PEEK, titanium, specialty optical polymers, proprietary fabric blends) cost dramatically more — sometimes ten or more times the commodity equivalent.
The right material decision depends on what the product actually needs the material to do. A consumer product that needs to be cheap, durable, and easy to mold can typically use ABS or polypropylene — commodity plastics that meet the requirements at minimum cost. The same product specified in PEEK or polycarbonate, when the application doesn’t require it, pays for performance the customer never benefits from. Material specification should match function, not impression.
For consumer products and electronics, common cost-driving material decisions include premium plastics specified when commodity plastics would have worked, custom colorants when standard colors would have been acceptable, and specific resin grades when material datasheet performance suggests multiple grades would qualify. Each over-specification adds cost per unit across the entire production run.
For soft goods, material economics are particularly nuanced because fabric mills typically have minimum order quantities measured in hundreds or thousands of yards — often well above first-launch volumes. A custom fabric specification may cost more in MOQ commitment than the entire prototype budget. Working within fabrics that meet existing supplier MOQs is dramatically cheaper than commissioning custom fabric runs. Premium hardware (YKK Excella zippers vs standard zippers, custom-molded buckles vs catalog hardware) follows similar logic — cost differences can be significant per unit.
For hardwood products, species and grade selection are the dominant material cost drivers. White oak in #1 Common grade costs less than walnut in FAS grade by a meaningful multiple. Specifying premium species when the application doesn’t require it pays for the species premium across every piece produced. Reclaimed hardwoods can deliver both cost savings and a sustainability story when matched to the right product positioning.
Material substitution is often the cheapest cost-reduction lever available to first-time inventors. A material substitution that delivers equivalent function at lower cost is essentially free money — the design works the same, the customer experience is the same, but the per-unit cost drops. Working with an engineering team that knows the material landscape across multiple categories (commodity to engineering to exotic) makes material substitution decisions visible at the design stage, when they’re cheap to make.
The discipline is to specify materials based on function and then validate whether a less expensive material would deliver equivalent function. The default for many first-time inventors is to specify the material they’ve seen used in premium products in the category — which often costs more than the application requires. Materials should be chosen for what they need to do, not for what they signal at retail when the signaling cost exceeds the marketing value.
Material costs vary across orders of magnitude: commodity, engineering, and exotic tiers.
Match material to function — not to impression or category convention.
Consumer/electronics: premium plastics, custom colorants, and specific resin grades often over-specified.
Soft goods: fabric MOQs and premium hardware are dominant material cost drivers.
Hardwood: species and grade selection drive cost more than any other material decision.
Material substitution is often the cheapest cost-reduction lever — equivalent function at lower cost.
Premium materials are worth their cost when the application genuinely requires them. They’re wasted cost when specified by default. The discipline of validating material selection against application requirements is what separates productive material spending from category-imitation spending.
Process Selection: Matching Method to Volume and Question
Process selection is one of the most expensive single decisions in prototype manufacturing. Each process — 3D printing, CNC machining, soft tooling, hard tooling — has an economic range of volumes where it makes sense. Outside that range, the same prototype costs dramatically more than it would in the right process. Process-to-volume mismatch is one of the most common ways first-time inventor budgets get burned without producing proportional value.
Each prototype manufacturing process has a different economic profile across volume:
3D printing has very low fixed cost (essentially zero setup) and moderate per-unit cost. The economics work best for one to a few dozen units. Above that, the per-unit cost stays the same while the total volume drives total cost up linearly — making 3D printing expensive for higher volumes compared to other methods. 3D printing is the right choice for concept validation, form studies, fit checks, ergonomic prototypes, and small functional runs where the per-unit cost is acceptable. It is generally not the right choice for production-intent testing at the unit cost of the eventual production product, and not the right choice for higher-volume runs where other methods would be cheaper.
CNC machining has moderate fixed cost (setup per part) and moderate per-unit cost in production-grade materials. The economics work well for one to a few hundred units, depending on part complexity. CNC excels at functional prototypes that need to survive load testing in production-equivalent materials — mechanism validation, durability testing, performance characterization. At higher volumes, soft tooling or hard tooling typically becomes cheaper per part.
Soft tooling (also called bridge tooling or rapid tooling) has higher fixed cost (tool fabrication) and lower per-unit cost than CNC at moderate volumes. The economics work well for hundreds to a few thousand units. Soft tooling produces parts using injection molding processes that closely simulate production injection molding, which makes it the right choice for production-process validation, pilot production runs, and early commercial launches at moderate volume.
Hard tooling (production steel tooling) has high fixed cost and lowest per-unit cost. The economics work best for high volumes — typically thousands to millions of units across the tool life. Hard tooling is the right choice for production-scale manufacturing once the design is validated. Hard tooling for low or moderate volumes burns the fixed cost against limited unit count, producing high per-unit cost overall.
The economic crossover points between processes depend on part complexity and material, but typical patterns are: 3D printing to CNC around 20–50 units; CNC to soft tooling around 200–1,000 units; soft tooling to hard tooling around 5,000–10,000 units. Inventors who commit to a process without checking the crossover for their specific volume risk paying dramatically more than necessary.
Process-to-question matching matters as much as process-to-volume matching. Some questions can only be answered by certain processes. Production-process behavior questions — will the injection-molded part survive demolding cleanly? — require soft tooling or hard tooling, not 3D printing or CNC. Material certification questions for plastics typically require samples molded in the actual production process. User testing on the production aesthetic requires production-process samples, not CNC machined parts that look different from molded parts. Choosing a process that can’t answer the question being asked produces prototype work that has to be redone in the right process — paying twice for the answer.
For other Rabbit verticals, equivalent process-to-volume considerations apply. Soft goods has hand-sewn sampling, sample-room construction, and production-line manufacturing — each with its own volume range. Hardwood has hand-built mockups, CNC-routed prototypes, and production woodshop output — each with its own economics. Electronics has development boards, custom prototype PCBs, and production-fab PCBs — with different cost structures and lead times.
CNC machining: moderate fixed cost, moderate per-unit; best for 1 to a few hundred units in production materials.
Soft tooling: higher fixed cost, lower per-unit; best for hundreds to a few thousand units.
Hard tooling: high fixed cost, lowest per-unit; best for thousands to millions of units.
Process must match both volume and the question being asked.
Equivalent process-to-volume considerations apply across soft goods, hardwood, and electronics.
Process selection done deliberately by someone who knows the economic crossover points is one of the highest-leverage cost decisions in prototyping. Process selection done by default — picking the method the inventor or vendor is comfortable with — is one of the most common ways cost balloons unnecessarily.
Iteration Count: How Multiple Cycles Multiply Cost
Each prototype iteration has a cost. Multiple iterations are normal and expected — the prototype sequence is built to surface different categories of issues at each iteration. But poorly-planned iterations multiply cost across cycles that surface the same lesson at progressively higher fidelity. Managing iteration count is among the most direct cost-control disciplines in prototype manufacturing.
The most expensive iteration cost driver is design-for-manufacturing problems that surface late. A part designed without DFM consideration may pass concept and functional prototype stages — because 3D printing and CNC machining can produce geometry that injection molding cannot. The DFM problems then surface when the design hits soft tooling or hard tooling, requiring redesign and re-prototyping. Each re-iteration carries the cost of the previous iteration plus the engineering hours to redesign plus the lead time to re-prototype. DFM review at the design stage prevents this cascade.
The second most expensive iteration cost driver is wrong fidelity choices. A prototype built at high fidelity when low fidelity would have answered the question wastes the high-fidelity cost. A prototype built at low fidelity when high fidelity was needed produces an answer that doesn’t hold up at the next stage, requiring re-iteration at the right fidelity. Fidelity discipline — matching fidelity to the question being asked — reduces the iteration count to what each phase actually requires.
The third iteration cost driver is late design changes. A design change made at the CAD stage costs engineering hours. The same change made after the prototype is built costs the engineering hours plus a re-iteration. The same change made after soft tooling is committed costs the engineering hours plus a tooling rework plus re-iteration. The same change made after hard tooling is committed costs the engineering hours plus potentially scrapped tooling plus re-iteration. Each delay in finalizing the design multiplies the cost of changes that should have been made earlier.
The fourth iteration cost driver is skipped phases. A project that goes from rough concept directly to production-representative prototype skips the intermediate iterations that would have caught problems at lower cost. The production-representative prototype surfaces issues, requires re-iteration, and the re-iteration is at the most expensive fidelity tier. Phases exist for cost reasons — each phase catches problems at progressively higher cost, and skipping early phases doesn’t skip the discoveries, it just makes them more expensive.
The fifth iteration cost driver is inadequate documentation between iterations. A prototype iteration that doesn’t generate documentation of what was learned forces the next iteration to potentially re-test the same questions. Documentation builds incrementally through the prototype sequence — each iteration’s outputs feed the next iteration’s inputs. Documentation gaps produce iteration count inflation as the project re-discovers what an earlier iteration already established.
The discipline that controls iteration count is the discipline of running each iteration deliberately: defining what the iteration is supposed to prove, building at the right fidelity to prove it, documenting what was learned, and advancing to the next iteration when the questions at the current iteration are answered. Iteration count managed this way reflects the actual complexity of the project. Iteration count not managed this way reflects the cumulative cost of mistakes at earlier stages.
DFM problems surfacing late: re-iteration cost compounds across phases.
Wrong fidelity choices: prototypes built at the wrong fidelity tier produce iteration cycles.
Late design changes: every delay multiplies the cost of the change.
Skipped phases: discoveries happen at the most expensive possible fidelity.
Inadequate documentation: iteration count inflates from re-discovering what earlier iterations established.
Iteration count is the cumulative result of upfront discipline. Inventors who run each iteration with clear purpose, right fidelity, and documented outputs typically need fewer total iterations than inventors who run iterations reactively. The iteration cost is shaped by what happens before each iteration starts.
Documentation, Coordination, and Hidden Vendor Costs
Documentation and coordination costs don’t typically appear on prototype quotes. They show up as schedule slippage, engineering time spent answering vendor questions, mis-delivered parts that require re-iteration, version control failures, and the integration burden of multi-vendor projects. These hidden costs can match or exceed the direct prototype manufacturing cost — and are among the most common sources of budget overruns in first-time inventor projects.
Documentation gaps create cost through multiple mechanisms. A vendor receiving incomplete documentation may ask the inventor or design team for clarification — which costs engineering time on the inventor’s side and slows the project on the vendor’s side. A vendor receiving incomplete documentation may make assumptions about what wasn’t specified — which produces parts that don’t match the inventor’s actual intent and require re-iteration. A vendor receiving outdated documentation may produce parts to the wrong revision — wasting the entire iteration. Documentation that’s complete, current, and version-controlled prevents all three failure modes.
The components of complete prototype documentation include: production-intent CAD files with version numbers; production drawings with quantifiable acceptance criteria; bill of materials with specific part numbers and approved sources; material specifications with grade and source; tolerance specifications with documented reasons; assembly drawings and sequences; test specifications and acceptance criteria; surface finish standards; and the contact information for the responsible engineer for follow-up questions. Documentation that’s missing any of these produces gaps that the vendor will fill with defaults that may or may not match the inventor’s intent.
Multi-vendor coordination costs surface in different ways. Each vendor optimizes for their own scope; nobody owns the integration. The inventor becomes the integration layer between vendors who don’t naturally communicate. Schedule dependencies between vendors require explicit management. Version control across multiple vendors generates errors that single-team projects don’t generate. IP risks fragment when work spans multiple vendors with separate NDAs. The total coordination cost across multiple vendors typically exceeds what the inventor estimated based on each individual quote.
The benefit of integrated documentation and single-team coordination is direct: a single team maintains version-controlled documentation, owns the integration across disciplines, communicates internally rather than across vendor boundaries, and presents the inventor with a coherent view of the project. The total cost of an integrated engagement is typically lower than the sum of individual vendor quotes, because the coordination cost that distributes across multiple vendors collapses into the single team’s coordinated work.
For first-time inventors, the practical implication is that the cheapest-looking option is rarely the cheapest total option. A series of low quotes from individual vendors who each handle a piece of the project can total to dramatically more than a higher-quoted integrated engagement that handles the project end-to-end. Coordination cost is real and significant — just hidden in the way prototype quotes typically present cost.
Documentation gaps create cost through clarification time, wrong assumptions, and outdated revisions.
Complete documentation includes CAD, drawings, BOM, materials, tolerances, assembly, test specs, finish standards.
Multi-vendor coordination: nobody owns integration; the inventor becomes the integration layer.
Integrated documentation under one team collapses coordination cost into coordinated internal work.
Cheapest individual quotes often total to higher total cost than integrated engagements.
Documentation and coordination are real cost drivers — just hidden ones. Inventors who account for the hidden costs in their project planning make better total-cost decisions than inventors who optimize only against the visible per-quote numbers.
How Rabbit Product Design Manages Prototype Cost Across the Four Phases
Rabbit Product Design is a product development firm built around the inventors, entrepreneurs, and small business owners who carry the most risk on a first physical product. The firm has been in business for nine years, has worked on over 2,000 products, and is staffed entirely by senior engineers — an average of 27 years of experience per team member.
Cost discipline is embedded in every engagement rather than offered as a separate service tier. The senior engineers making CAD decisions during Phase 2 are the same engineers who carry the cost-driver judgment from thousands of prior projects. The tolerance specifications they recommend are at the loosest level the design requires. The materials they specify match function rather than category convention. The process selection they propose matches the volume and the question being asked. The iteration sequence they plan reflects what the project actually needs to validate rather than what feels like progress. Documentation builds incrementally throughout development rather than getting assembled at the end. The coordination overhead that distributes across multiple vendors in fragmented engagements collapses into coordinated work under one team.
The four-phase development model maps cost discipline to each phase. Phase 1 (Research & Ideation) addresses the upstream cost decisions: patent research informs IP risk that affects total cost; product evaluation confirms market and unit economics; technology research validates that materials, components, and processes exist at target cost. Phase 2 (Design & Prototype) is where most cost drivers are set: design complexity, tolerances, material selection, fidelity choices, and process selection all happen here, with embedded DFM review that prevents the expensive iteration cycles that DFM problems cause. Phase 3 (Sourcing & Manufacturing) handles supplier qualification (where the lowest quote is rarely the lowest total cost), tooling decisions sized to actual launch volume, and pilot production. Phase 4 (Branding & Marketing) covers launch operations.
On the cost question that first-time inventors weigh: the senior-engineer model produces lower total project cost even at higher per-hour rates. The mechanism is direct: senior engineers know which cost drivers actually matter and which can be relaxed; they specify tolerances at the right level rather than at the tightest default; they select materials by function rather than by category convention; they choose processes matched to the project’s volume rather than by familiarity; they run iterations at right fidelity rather than at maximum fidelity. The cost-positioning frame is simple: a higher hourly rate paid for experience that prevents expensive mistakes produces lower total cost than a lower hourly rate paid to teams whose inexperience generates the expensive mistakes the senior engineers avoid.
Three things shape how engagements run day-to-day. Senior engineers handle every project from the start — there is no junior tier doing the early work where cost-driver decisions get made. Cost discipline is embedded in design decisions rather than applied as a corrective measure after problems surface. And the firm is built to be accessible to people developing their first product, not only to funded startups with seven-figure budgets.
Key Services
Phase 1 — Research & Ideation
Patent research and freedom-to-operate analysis
Patentability assessment and filing strategy
Product evaluation and unit economics validation
Technology research and material technology landscape mapping
Phase 2 — Design & Prototype
Industrial design and creative product design
Mechanical engineering with embedded DFM and cost-driver review
Electronics design, firmware development, and app development
Prototyping: from printing to molding, CNC machining, and soft tooling — selected to match volume and question
Design reviews at defined gates with tolerance, material, and process decisions documented
Phase 3 — Sourcing & Manufacturing
Supply chain qualification across domestic and overseas suppliers
Tooling decisions sized to launch volume
Factory management and quality control
Production builds, shipping, and logistics
Phase 4 — Branding & Marketing
Brand identity and positioning
Go-to-market strategy
Operational launch support
Key Benefits
Senior engineers on every project, averaging 27 years of experience
Cost discipline embedded in design decisions — not bolted on as a separate review
Tolerances, materials, processes, and iterations selected for what the project actually needs
Lower total project cost through right-sized decisions, not through cheaper labor
Integrated documentation under one team eliminates multi-vendor coordination overhead
9 years and over 2,000 products of accumulated cost-driver experience across multiple verticals
End-to-end services accessible to individual inventors, not only to funded companies
To start a product development engagement with cost discipline embedded across all four phases — not bolted on as a corrective measure — contact Rabbit Product Design.
Conclusion
Prototype manufacturing costs are driven by seven controllable factors: design complexity, tolerances and surface finish, material selection, process-to-volume matching, iteration count, documentation quality, and vendor coordination. None of them is random. Each can be examined and influenced through deliberate decisions at the design stage. For inventors, entrepreneurs, and small business owners with limited budgets, the discipline of understanding what drives cost — and acting on that understanding from Phase 1 onward — is the difference between prototyping that protects the launch and prototyping that burns budget without delivering proportional value. To start a product development engagement where cost-driver decisions are made deliberately by senior engineers across all four phases, contact Rabbit Product Design.
FAQ
Why do prototype quotes vary so widely for what looks like the same prototype?
Quotes vary because each vendor is interpreting the same prototype request against different assumptions about complexity, tolerances, materials, process, iteration count, and documentation quality. A cheap quote may assume commodity material, standard tolerances, and minimal inspection; an expensive quote may assume premium material, tight tolerances, and certification-quality documentation. Until the inventor knows what they actually need, every quote is comparing apples to oranges — and the cheapest quote often delivers a prototype that doesn’t answer the question being asked.
What is the single biggest cost driver in prototype manufacturing?
There isn’t a single biggest driver; the dominant cost driver varies by project. For a complex consumer product, design complexity and tolerances may dominate. For a soft good, fabric MOQs and sample iteration cycles may dominate. For a hardwood product, species and grade selection plus finishing labor may dominate. For an electronic product, PCB complexity, certification, and firmware-hardware coordination may dominate. Understanding the cost-driver profile for the specific vertical is the first step in managing prototype cost intelligently.
Should I specify tight tolerances to ensure quality?
Generally no — specify the loosest tolerance that still works for each feature. Tight tolerances cost dramatically more than standard tolerances (five to ten times per feature is typical, more for the tightest precision work). Tolerances should be tight only when the design genuinely depends on that precision, with a documented reason. Tolerances that are tight by default — the CAD package suggested it, or the inventor associated tightness with quality — are tolerances that cost more without delivering proportional value. Every over-specified tolerance is paid for in every unit produced, not just in the prototype.
How do I choose the right manufacturing process for my prototype?
Match the process to both the volume you need and the question you’re trying to answer. 3D printing works best for 1 to a few dozen units of concept or form-study prototypes. CNC machining works well for 1 to a few hundred units of functional prototypes in production-equivalent materials. Soft tooling works well for hundreds to a few thousand units of production-process-equivalent samples. Hard tooling works best at thousands to millions of units of production-scale work. Some questions (production-process behavior, material certification, production aesthetic) can only be answered by certain processes — process selection has to match both the volume and the question.
Is the cheapest prototype vendor usually the cheapest total cost?
Usually no. The cheapest per-quote number often comes with hidden costs: incomplete documentation that creates clarification time and re-iteration; missing engineering judgment that produces designs requiring more iteration cycles; multi-vendor coordination that places the integration burden on the inventor. The total cost of prototyping — including iteration count, schedule slippage, engineering time spent on coordination, and re-iteration when the first attempt doesn’t meet the actual requirement — is typically a different number from the lowest per-quote total. Working with a senior engineering team that produces complete documentation, makes right-sized decisions at the design stage, and handles project integration in-house usually produces lower total cost than coordinating multiple low-quote vendors.
Sources
Keywords: prototype manufacturing cost, prototype cost drivers, design for cost, tolerances and cost, material cost, process selection cost, iteration cost, prototype budget
